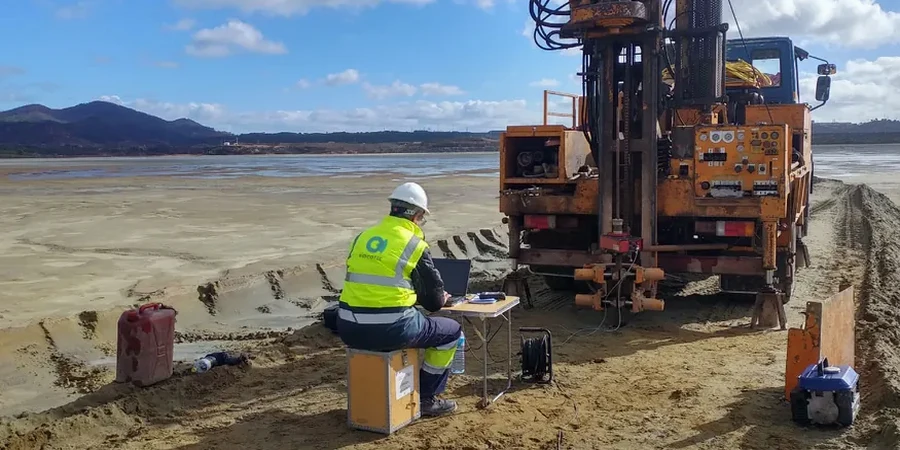
Brantford’s expansion from a historic manufacturing hub along the Grand River into a modern logistics and residential center has placed new demands on how we understand the ground beneath us. The city sits atop a complex sequence of glacial till, glaciolacustrine deposits, and Paleozoic bedrock that varies dramatically over short distances—something we encounter routinely when characterizing sites near the river valley versus the upland plateaus. Seismic microzonation bridges the gap between regional hazard maps and the actual soil column at your project location, providing the site-specific spectral acceleration values that structural engineers need to comply with the current National Building Code of Canada. Rather than relying on generic amplification factors, our team integrates MASW and seismic refraction surveys with borehole data to map shear-wave velocity profiles that reveal how local geology will actually modify bedrock motion during a significant earthquake.
Two sites separated by 300 meters in Brantford can fall into different NBCC site classes, and that single-letter difference drives the entire seismic design.
Process and scope
Local considerations
A recurring observation from our fieldwork along the Grand River corridor is that boreholes terminated at auger refusal are sometimes interpreted as bedrock, when in reality the drill hit a dense boulder layer within the till—and the actual bedrock sits another eight to ten meters deeper. This misidentification has real consequences for seismic microzonation because it produces an artificially shallow impedance contrast that will not match the site’s true dynamic response. We routinely cross-check refusal depths with resistivity and refraction profiles to avoid building a ground model on a phantom reflector. Another risk specific to Brantford involves the paleovalley system incised into the bedrock surface beneath the modern river channel: the soft organic silts and loose sands that fill these buried valleys generate strong amplification and can sustain excess pore pressure for extended durations during long-period shaking, a scenario that conventional SPT-based liquefaction assessments may under-predict unless coupled with site-specific liquefaction triggering analyses that account for fines content and aging effects in the glaciolacustrine deposits.
Video overview
Reference standards
NBCC 2020 Part 4: Structural Design – Section 4.1.8 (Earthquake Loads), CSA A23.3:19 – Design of Concrete Structures (seismic provisions), ASTM D4428/D4428M-14 – Standard Test Methods for Crosshole Seismic Testing (adapted for downhole applications), NCEER/NSF (Youd & Idriss, 2001) – Liquefaction Resistance of Soils: Summary Report, and ASCE/SEI 7-22 Chapter 20 – Site Classification Procedure for Seismic Design.
Associated technical services
Site-Specific Seismic Hazard Assessment
Single-lot or single-building assessment combining one MASW line, one seismic refraction spread, and correlation with existing borehole logs to produce a definitive NBCC Site Class letter and design spectral accelerations. Recommended for commercial and institutional buildings where the cost of over-design or under-design justifies the investigation.
Subdivision and Corridor Microzonation
Area-wide mapping on a measurement grid with typical 75–150 m node spacing. Deliverables include Vs30 contour maps, site period maps, and liquefaction hazard zonation overlaid on the development plan. Used by land developers and municipal infrastructure planners to optimize foundation typologies and stormwater routing across variable ground conditions.
Brantford-Specific Ground Response Analysis
One-dimensional equivalent-linear or non-linear site response modeling using DEEPSOIL or similar platforms, calibrated to the local glacial stratigraphy and input motions matched to the NBCC uniform hazard spectrum. This module is specified when performance-based design or tall-building peer review requires time-history output rather than spectral acceleration factors alone.
Typical parameters
Questions and answers
What is the typical cost range for a seismic microzonation study on a commercial lot in Brantford?
How does the NBCC 2020 site classification procedure differ from the 2015 edition for sites like those found in Brantford?
The NBCC 2020 retains the same Vs30-based site class framework as the 2015 edition (Classes A through E) but updates the ground motion hazard values for southern Ontario based on the 6th Generation seismic hazard model. For Brantford, this means the reference bedrock spectra have shifted modestly at short periods, and the importance of accurate site classification has increased because the spectral amplification factors applied to the updated hazard values directly control the design base shear. Our reports reference both NBCC 2020 and the applicable CSA A23.3 seismic provisions to ensure the structural engineer has consistent input data.
What geophysical methods do you use to determine Vs30 in the glacial deposits around Brantford, and how deep do you investigate?
We primarily use the multichannel analysis of surface waves (MASW) method, supplemented by seismic refraction where a sharp bedrock interface is expected. The array geometry is configured to achieve a minimum investigation depth of 30 meters for Vs30 calculation, and we often extend to 50 meters or more in areas where the paleovalley fill beneath the Grand River is suspected to be deeper. All measurements are processed against borehole logs to verify the inversion model, and we routinely run a second orthogonal spread when the site is near a known geological transition to check for lateral variability.