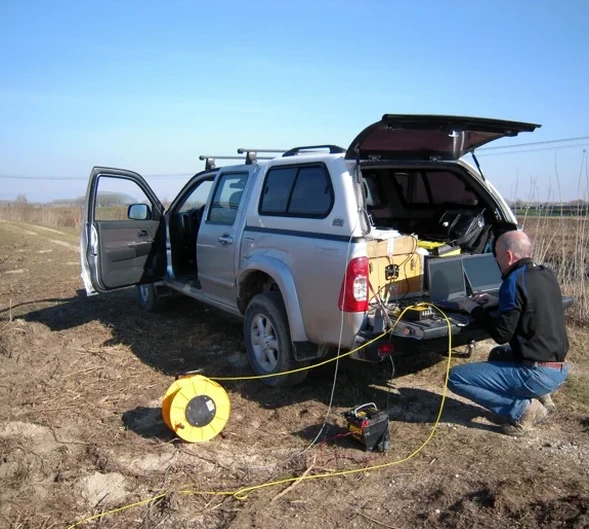
The field crew arrives on site with a 24-channel seismograph, a spread of 4.5 Hz geophones laid out across the Brantford property, and a sledgehammer source or accelerated weight drop depending on target depth. In the Grand River valley, where glacial till and Paleozoic bedrock interfaces shift abruptly over short distances, seismic tomography provides a continuous cross-sectional image of P-wave and S-wave velocity variations. The method works by measuring travel times of refracted and reflected wavefronts along the geophone array, then inverting those arrival picks with ray-tracing algorithms to reconstruct a velocity model. For engineers planning foundations on the Silurian dolostone of the Guelph Formation or investigating buried valleys filled with sands and gravels, this non-invasive approach clarifies the depth to competent rock without the blind spots that borehole-only campaigns leave behind. We run the acquisition at 2-meter geophone spacing for high-resolution near-surface targets and extend the spread length when the objective is mapping bedrock topography deeper than 15 meters, always calibrating results against the Quaternary geology mapped by the Ontario Geological Survey for the Brantford area.
A tomographic velocity cross-section reveals what isolated boreholes cannot: the continuous shape of the bedrock surface, including paleovalleys and fracture zones that control groundwater flow and excavation stability.
Methodology and scope
Local considerations
Brantford sits at approximately 200 meters above sea level along the Grand River, with a population exceeding 100,000 residents in a region where the sedimentary bedrock is mantled by glacial deposits of variable thickness. The primary geotechnical uncertainty across the city is not the presence of strong rock — the Guelph Formation dolostone is a competent bearing stratum — but the irregular topography of the rockhead surface and the occurrence of buried bedrock valleys infilled with compressible silt and loose sand. These paleovalleys, documented in Ontario Geological Survey mapping, can drop the bedrock surface by 10 meters or more over a lateral distance of less than 30 meters. A foundation designed on the assumption of uniform rock depth, based on one or two boreholes, risks differential settlement if a narrow buried channel passes beneath the building footprint. Seismic tomography addresses this hazard directly by imaging the velocity contrast across the overburden-bedrock interface along continuous profiles, mapping the thalweg of the buried valley so that foundation type and depth can be adapted — whether that means extending footings to rock or specifying engineered fill to bridge the depression.
Explanatory video
Applicable standards
ASTM D5777-18: Standard Guide for Using the Seismic Refraction Method, ASTM D7128-18: Standard Guide for Using the Seismic Reflection Method, NBCC 2020: National Building Code of Canada – Seismic Site Classification
Associated technical services
Bedrock Profiling and Paleovalley Mapping
Continuous P-wave tomography lines across the building footprint or infrastructure corridor to delineate rockhead depth and identify buried valleys in the glacial overburden.
Rippability and Excavatability Assessment
Velocity-based rippability classification using published Caterpillar D8/D9 charts, indicating which rock units can be ripped and which require hammer or blasting.
Seismic Site Class Determination Support
Integrated refraction and MASW acquisition to provide both P-wave stratigraphy and Vs profiles for NBCC 2020 site class assignment.
Typical parameters
Frequently asked questions
What depth can seismic tomography reach on Brantford sites?
With a standard 115-meter spread and a sledgehammer source, we typically resolve velocity structure to depths of 25 to 35 meters in Brantford's glacial overburden. Using an accelerated weight drop extends the investigation to approximately 40 meters, sufficient to image the bedrock surface across most of the city.
How does the Grand River valley geology affect the seismic results?
The valley fill includes saturated sands and gravels with low P-wave velocities, which create a strong velocity contrast against the dolostone bedrock. This contrast produces clear refracted arrivals and makes the bedrock interface a reliable seismic marker, though careful processing is required where perched water tables create velocity inversions in the upper layers.
Can seismic tomography detect karst features in the Guelph Formation?
Tomographic inversion can image lateral velocity reductions associated with fracture zones and solution-enlarged joints in the dolostone. However, small individual cavities below the resolution limit of the geophone spacing may not be directly detected. We recommend combining tomography with targeted drilling where karst is suspected based on regional mapping.
How much does a seismic tomography survey cost in Brantford?
For a typical 115-meter seismic line processed with tomographic inversion, the cost ranges from CA$3,620 to CA$6,760 depending on the number of lines, access conditions, and whether MASW acquisition is included for shear-wave velocity profiling.
How long does it take to get results after the field survey?
Field acquisition for two to three lines is normally completed in one day. Processing and interpretation, including tomographic inversion and generation of geologic cross-sections, are delivered within five working days. We provide preliminary velocity models earlier if the construction schedule requires it. More info.